 Lynn pedestrian safety has become a serious public concern in Massachusetts. As a Massachusetts personal injury attorney, I spend much of my professional life reviewing crash reports, medical records, and the small details that permanently alter families’ lives.
By Matthew Rubner, Lynn, Massachusetts Personal Injury Attorney
Why Lynn Pedestrian Safety Has Become a Public Crisis
Lynn pedestrian safety has become a serious public concern, supported by Massachusetts statewide crash data, repeated pedestrian injuries, and recent fatalities. Every so often, however, a public safety report cuts through the noise and confirms what many residents already know from experience: certain places are dangerously unforgiving for pedestrians.
The most recent Top Crash Locations–style analyses identify “Top Pedestrian Crash Clusters” statewide using rolling 10-year windows of data. Earlier reports, including the 2008–2017 HSIP pedestrian cluster analysis published in 2020, rely on an EPDO (Equivalent Property Damage Only) weighting model, where a single injury crash—fatal or non-fatal—is weighted as the equivalent of 21 property-damage-only crashes. More recent MassDOT pedestrian cluster datasets, including the 2011–2020 and 2012–2021 HSIP analyses, show that the problem in Lynn has not improved. By several measures, it has worsened.
That EPDO weighting is not a spreadsheet trick. It is a deliberate effort to force rankings to reflect harm, not just volume.
In the 2008–2017 statewide rankings, Lynn appears twice in the top five pedestrian crash clusters.
One Lynn cluster ranked #2 statewide, with an EPDO score of 3235, reflecting 151 fatal-and-injury related crashes and 215 total crashes in the cluster area.
A second Lynn cluster is ranked #4 statewide, with an EPDO score of 1946, reflecting 91 fatal-and-injury related crashes and 126 total crashes in the cluster area.
Put plainly, two separate areas of Lynn were identified among the most dangerous pedestrian zones in Massachusetts, and both clusters were driven by serious injuries—not minor incidents.
Pedestrian Risk Factors in Lynn’s Urban Corridors
These Lynn clusters are not isolated intersections. They represent dense walking corridors where people live, shop, commute, and cross streets every day.
In the 2008–2017 statewide rankings, Lynn appears twice in the top five pedestrian crash clusters. One Lynn cluster ranks #2 with an EPDO score of 3,235, reflecting 151 fatal-and-injury crashes and 215 total crashes. A second Lynn cluster ranks #4 statewide with an EPDO score of 1,946, reflecting 91 fatal-and-injury crashes and 126 total crashes.
Put plainly, two separate areas of Lynn were identified among the most dangerous pedestrian zones in Massachusetts, and both clusters were driven by serious injuries—not minor incidents.
Lynn Pedestrian Safety: Where the Crash Clusters Are Concentrated
These clusters are not isolated intersections. They cover dense walking corridors where people live, shop, commute, and cross streets every day.
The #2 statewide cluster (EPDO 3235) encompasses much of Lynn’s downtown and commercial core, including areas along and around major corridors such as:
- Washington Street
- Broad Street
- Market Street
- Union Street
- Central Square and surrounding cross-streets
This area sees heavy foot traffic, frequent bus activity, multiple crossings in short distances, and constant vehicle turning movements — all conditions that elevate pedestrian risk when drivers are distracted, speeding, or rushing.
The #4 statewide cluster (EPDO 1946) covers another high-risk Lynn corridor, including stretches of:
- Boston Street
- Franklin Street
- Western Avenue
- Nearby residential and mixed-use side streets
These roadways combine neighborhood foot traffic with through-traffic speeds, limited sightlines, and frequent curbside activity — a dangerous mix for pedestrians of all ages.
That distinction matters because clusters aren’t single corners. The methodology intentionally groups nearby crash points into larger zones, recognizing that pedestrian danger often plays out along corridors and multi-crossing areas, not just at one marked crosswalk.
This approach reflects the real-world experience: streets where people walk to stores, cross to bus stops, head to school, and try to get home safely alongside fast-moving traffic.
When these clusters produce life-altering injuries, the road to justice often leads to Essex County Superior Court. In those halls, we don’t just present data; we tell the stories of the people behind these numbers. The human impact behind the numbers must be told.
Why Lynn Pedestrian Safety Remains a Serious Risk
Lynn pedestrian safety issues are not isolated events but recurring patterns reflected in long-term crash data and injury outcomes.
The data aligns with what many Lynn residents will tell you if asked honestly: walking in parts of the city is genuinely dangerous. When a city shows up twice in the top five statewide pedestrian crash clusters statewide, it typically reflects compounding risk factors—dense housing near arterial roads, frequent crossings, aggressive traffic patterns, limited nighttime visibility, and the daily friction between vehicles and people simply trying to get home.
To be clear, these reports do not assign blame or diagnose specific engineering failures. But from the injury side of this work, the pattern is familiar. These are environments where pedestrians are struck at speeds that cause catastrophic trauma, long-term disability, or death—leaving families with years of recovery, lost income, and permanent consequences.
This Isn’t Abstract for Me
When I was very young—around four or five years old—I witnessed a child slightly older than me struck and killed on Franklin Street in Lynn. Experiences like that do not fade. They shape how you see streets, risk, and responsibility long before you have adult language for it.
That experience is part of why I take pedestrian-injury cases personally. “Accidents can change someone’s life in an instant” is not a slogan when you have seen that instant unfold. Today, when I represent injured pedestrians and their families, the goal is accountability, meaningful safety change, and ensuring families are not left carrying the financial aftermath of preventable harm.
What the EPDO Ranking Is Really Saying
EPDO is designed to prevent a misleading conclusion like “this place has a lot of crashes, but they’re mostly minor.” The report explains that the EPDO weighting treats any injury crash (fatal or non-fatal) as equal to 21 property-damage-only crashes. MassDOT weights one injury crash the same as 21 fender-benders. This means these Lynn clusters aren’t just high-traffic; they are high-harm.
So when Lynn posts an EPDO of 3235 for a pedestrian cluster, that number is screaming: these are not trivial incidents. The cluster is producing harm — repeatedly — across a long period of time. And Lynn’s second cluster at EPDO 1946 reinforces that this isn’t a one-off “bad corner.” It’s multiple danger zones.
How the Newer Data Changed — And Why That Matters
More recent HSIP pedestrian safety datasets show that Lynn’s pedestrian danger has not diminished. What has changed is how the data is grouped.
More recent pedestrian safety datasets, including HSIP cluster analyses covering later 10-year windows (such as 2011–2020 and 2012–2021), show that Lynn’s pedestrian safety problem has not improved. In fact, by several measures, it has intensified.
DOT data now has Lynn’s new combined “District 4” including all of these areas had an EPDO of 5,507, ranking it top in the state for 2012-2021.
What has changed is how the data is grouped.
From a Lynn pedestrian safety perspective, changing how clusters are grouped does not change the level of risk pedestrians face on the ground.
Earlier reports, including the 2008–2017 HSIP pedestrian cluster analysis (published in 2020), identified multiple distinct high-risk pedestrian clusters within Lynn, each ranking among the most dangerous in the Commonwealth. Those clusters reflected separate corridors and neighborhoods, each producing serious injuries and fatalities over time.
In newer datasets, those same danger zones appear to have been combined into a single, much larger corridor-based cluster, spanning much of Lynn’s downtown and surrounding arterial streets. That merged cluster now carries an EPDO score exceeding 5,500, with more than 300 pedestrian crashes and well over 250 injury-producing incidents — ranking it #1 statewide in some analyses.
Why Merging Pedestrian Crash Clusters Changes the Story
From a statistical standpoint, this reflects a shift toward corridor-based safety modeling. From a practical standpoint, it raises an important question:
Does combining multiple dangerous areas into one massive cluster clarify the problem — or does it risk obscuring the fact that Lynn has multiple, distinct pedestrian danger zones that each demand attention?
Under the earlier framework, Lynn stood out because it appeared more than once in the top statewide rankings. That repetition mattered. It showed that the danger was not isolated to a single stretch of road, but embedded across different neighborhoods in the city.
Under the newer framework, Lynn still stands out — but now as one large, consolidated hotspot. While the total harm is undeniable, the consolidation can make it easier for decision-makers to frame the issue as a single long-term infrastructure challenge rather than multiple unresolved safety failures occurring in different neighborhoods.
Either way, the conclusion is the same: the danger did not go away. It grew.
Whether the problem areas are counted as two clusters or one, Lynn’s pedestrian corridors continue to produce serious injuries at an alarming rate, year after year. Methodology may change. The lived experience on the ground has not.
For residents walking these streets, the distinction between “separate clusters” and “one merged corridor” is academic. What matters is that the risk remains high, the injuries are severe, and meaningful safety improvements have lagged behind the data.
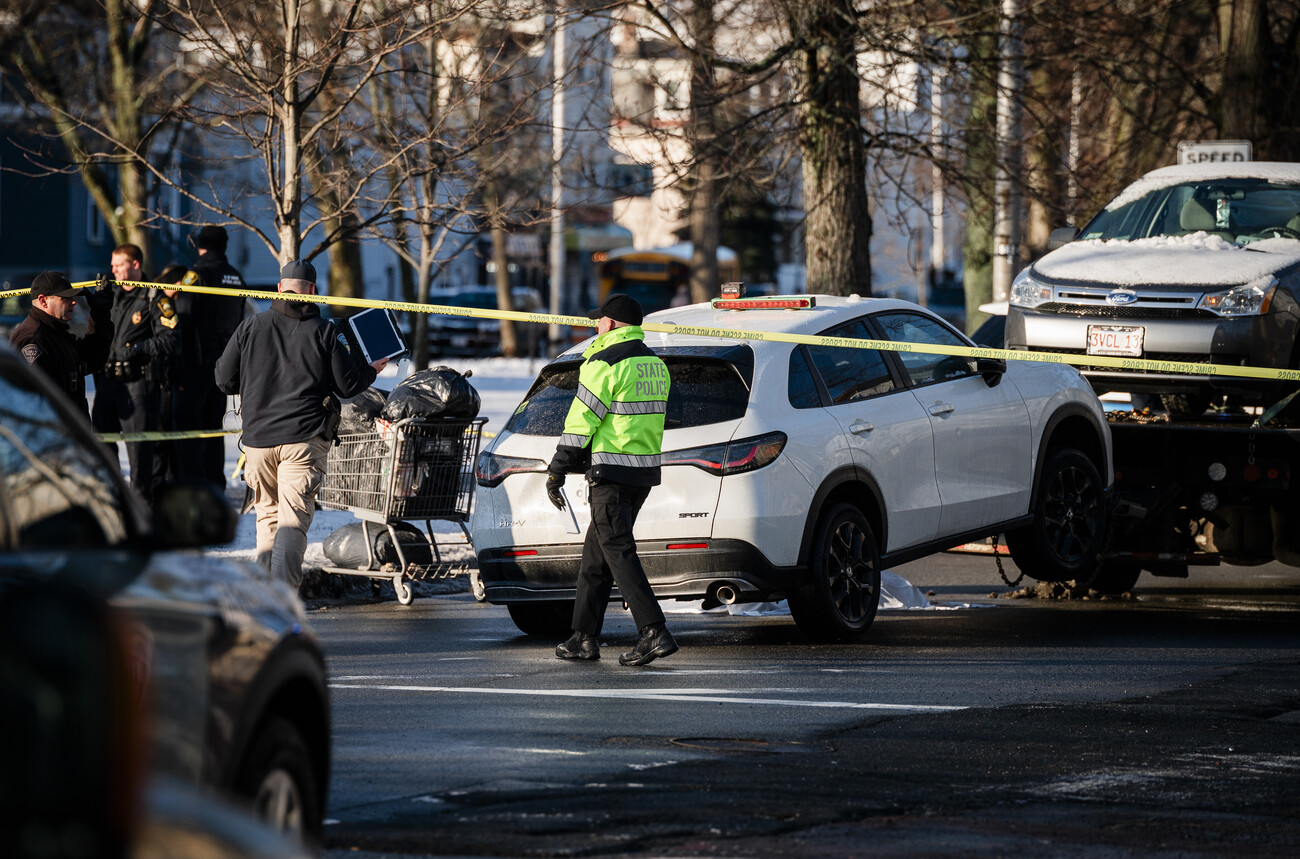
A Recent Example in the Same Corridors
The risk is not theoretical, and it is not confined to old data. On January 19, 2026—during a snowstorm—a pedestrian was struck and killed by a tractor-trailer at the intersection of the Lynnway and Commercial Street in Lynn. Neighbors told WCVB the intersection is dangerous even in good weather, and Massachusetts State Police confirmed the pedestrian was struck and killed by a tractor-trailer. The incident remains under investigation, and it was not immediately clear whether charges would be filed.
What Lynn Residents Can Do Right Now
If you live in Lynn (or you’re driving through), treat these areas like what the data suggests they are: high-risk zones.
Improving Lynn pedestrian safety requires both individual caution and systemic change.
For pedestrians: assume drivers don’t see you even when you have the right of way; avoid stepping out from between parked cars; use extra caution at dusk/night; and never assume a turning driver is yielding because they “should.”
For drivers: slow down in dense areas, especially near bus stops, schools, and commercial strips; eliminate phone distractions; and remember that “I didn’t see them” is not a defense to the harm that follows.
If You or a Family Member Were Hit While Walking
Pedestrian crash injuries often look “fine” in the first hours and become serious days later: brain injuries, spinal injuries, torn ligaments, fractures, and chronic pain conditions are common. Insurance companies often move fast early — not to help, but to lock in statements and minimize the claim before the full medical picture is clear.
If you or a loved one was hit by a car in Lynn or anywhere on the North Shore, get medical care and preserve evidence early (photos, video, witness names, police report info). Then get a real legal evaluation of the claim, including all available coverages and the long-term costs of the injuries.
A legal note is important here: MassDOT safety reports include federal-law limitations on admissibility in civil cases. That does not make the danger any less real. It simply means cases must be built correctly—through records, witnesses, and expert analysis—rather than relying on rankings alone.
Why This Data Matters to Me:
As a personal injury attorney focused on Lynn pedestrian safety, I’ve seen firsthand how these data points translate into real-world harm. I use my deep connection to Lynn and my experience in Essex County Superior Court to fight for those injured in these very zones.
Attorney Matt Rubner has a track record of success fighting for injured pedestrians, with numerous six figure verdicts and settlements for injured pedestrians and their families. As a lawyer who represents injured pedestrians and families across Lynn and the North Shore, I believe data like this should lead to real accountability — for drivers, for insurers, and for systems that fail to protect people on foot.
Lynn deserves safer streets, and when those streets fail someone, families deserve serious advocacy.
More information about Matt’s work representing injured Lynn residents is available at injuryfirmboston.com.
Sources
- https://geo-massdot.opendata.arcgis.com/search?q=pedestrian%20clusters
- https://geo-massdot.opendata.arcgis.com/datasets/f614a9f8dd674b858fa82f5a269901ee_23/explore?location=42.061336%2C-71.672058%2C8
- https://geo-massdot.opendata.arcgis.com/datasets/6a27dfcb75c143a5b08edef6819a639e_27/explore
- https://www.mass.gov/doc/2017-top-crash-locations-report/download